

Weekly report 2
Institutional strength across Solana continues to grow, while P0 has shifted away from emissions-driven farming toward more capital-efficient leveraged strategies.

Solana DeFi Overview
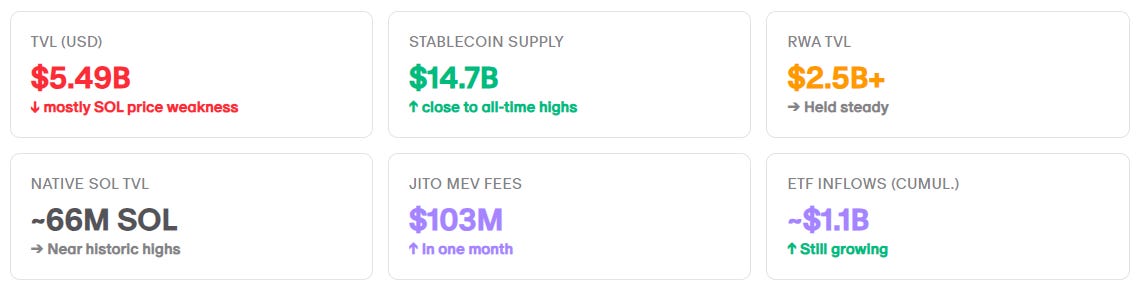
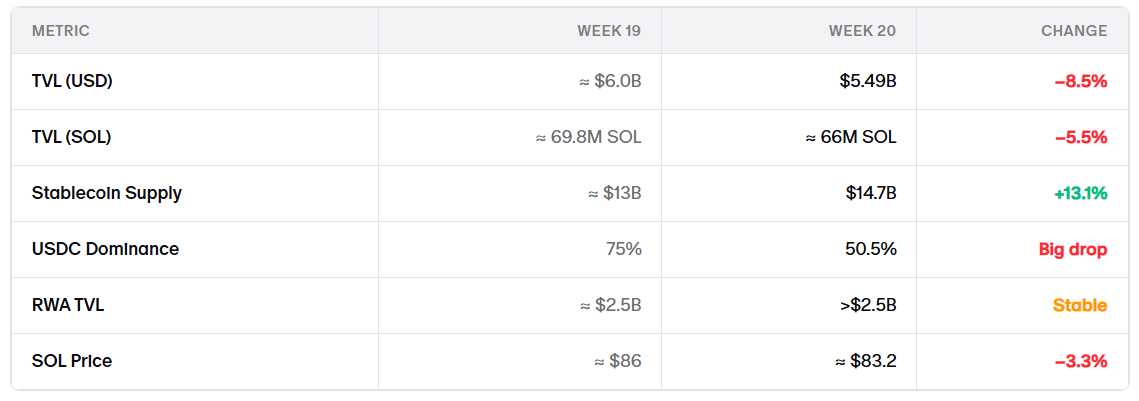
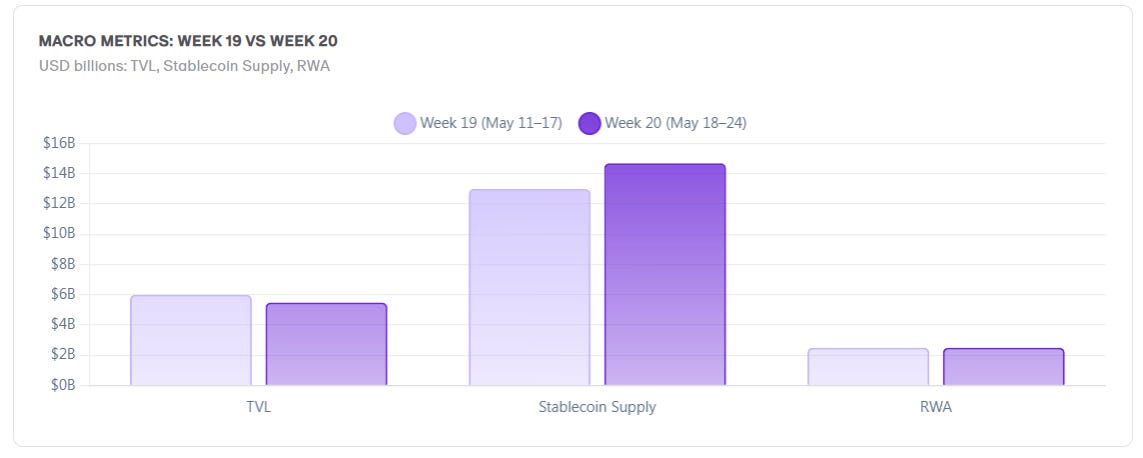
TVL fell 8.5% this week to $5.49B.
But most of the decline was driven by SOL price weakness rather than capital leaving the ecosystem. Meanwhile, stablecoin liquidity hit near ATHs, RWAs stayed stable, and institutional flows kept building.
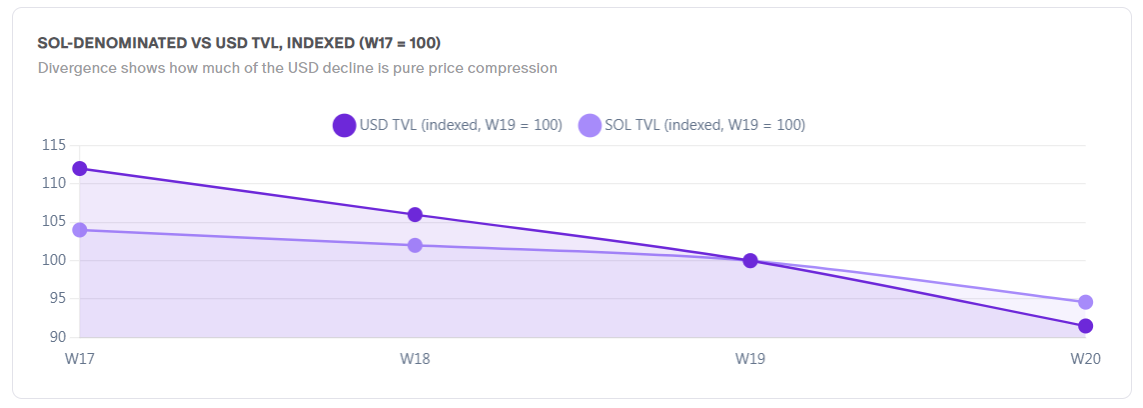
Price vs. Capital
Dollar TVL can be misleading during volatile weeks.
SOL fell around 3.3% WoW, which mechanically pushed TVL lower from ~$6B to $5.49B. Once adjusted for price, the actual capital outflow was much smaller than the headline numbers suggest.
Snapshot
Market Overview
TVL Attribution
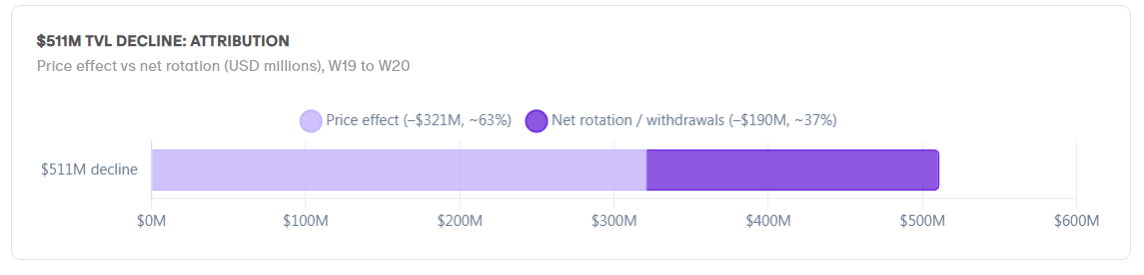
Total TVL declined by roughly $511M.
~$321M came from SOL price depreciation
~$190M came from actual repositioning
So roughly two-thirds of the decline came from valuation effects rather than users leaving Solana.
Native SOL TVL
Despite weaker USD TVL, native participation stayed strong.
Solana still has around 66M SOL locked on-chain, versus a peak near 80M earlier this year.
Stablecoin Rotation
This was the biggest shift of the week.
Stablecoin supply jumped from ~$13B to ~$14.7B as capital rotated into:
stablecoin vaults
lower-risk yield products
RWAs
defensive carry trades
The capital largely stayed on-chain; it simply rotated into safer positioning.
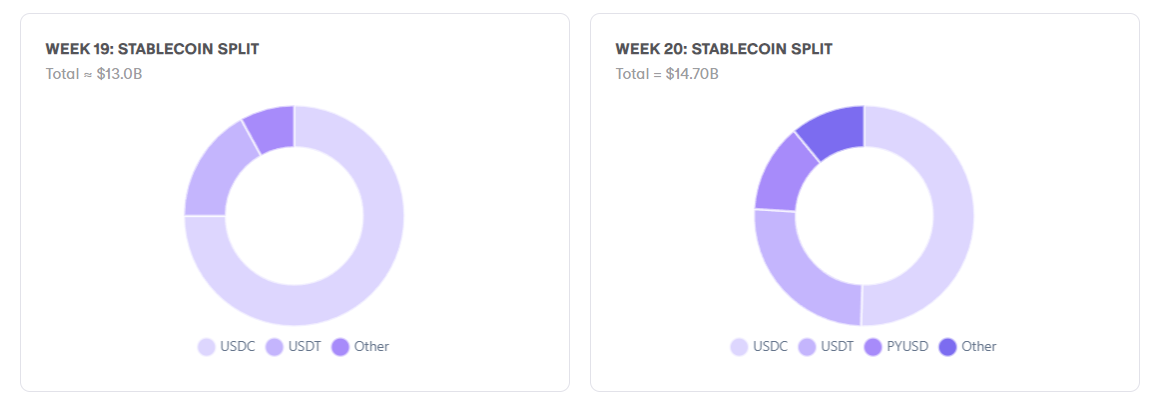
USDC Dominance
USDC dominance fell sharply from 75% to 50.5%.
Following the Drift exploit, liquidity diversified quickly into PYUSD, USDT, and other stablecoins. Non-USDC stablecoins gained over $4B in market share, while USDC balances dropped by ~$2.33B.
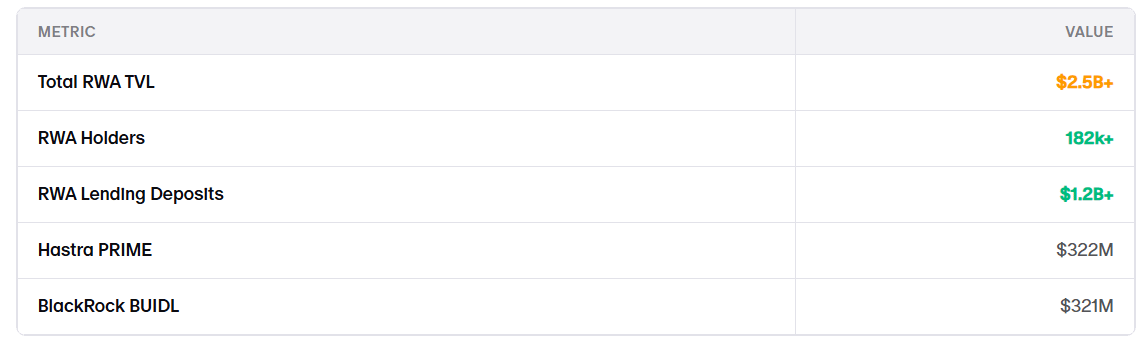
RWA on Solana
RWA liquidity remained stable despite broader DeFi weakness.
That matters because institutional capital typically moves more slowly and remains stickier than retail farming capital, making RWAs one of the more structural growth areas in Solana DeFi.
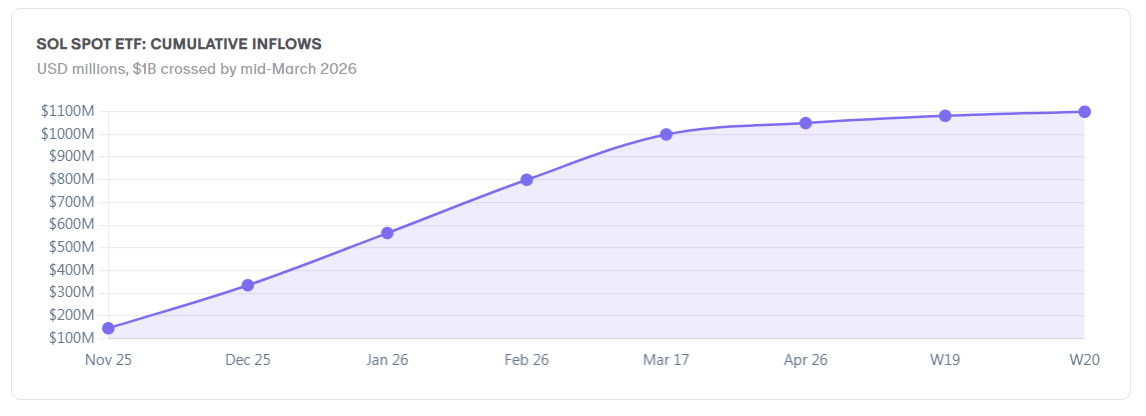
ETF Flow Picture
Spot SOL ETFs are now approaching $1.1B in cumulative inflows, with institutional investors representing a large share of demand.
Recent regulatory clarity around SOL’s commodity classification also helped remove a key barrier for traditional allocators.
Network Health
Application-layer revenue is now roughly 3.5x larger than base-layer revenue, showing that usage continues growing beyond simple L1 speculation.
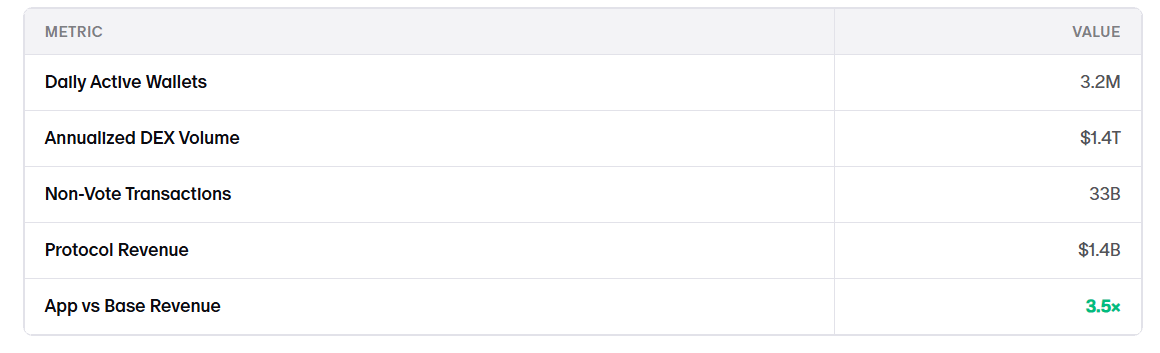
Jito
Jito continues to separate itself from the rest of the ecosystem. The protocol generated more than $103M in MEV fees in a single month.
Final Take
The market actually behaved in a surprisingly mature way.
Speculative capital rotated out. Stablecoins rotated in. RWAs stayed sticky. Institutional flows kept building. And native SOL participation remained historically strong.
P0 Overview
The old campaign-driven farming meta is no longer dominant. Instead, a more mature market is forming: stablecoin spreads, cheaper borrow markets, and more efficient leverage.
The data below covers Week 20 (May 18–24, 2026), compared with Week 19(May 11–27, 2026).
Overview
Two things defined the entire week.
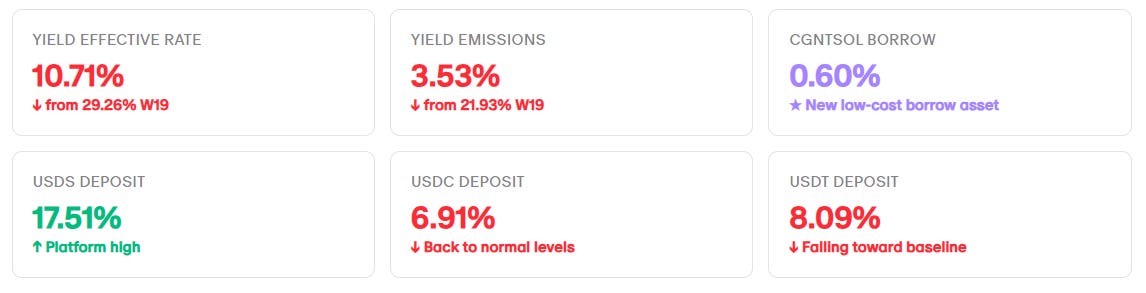
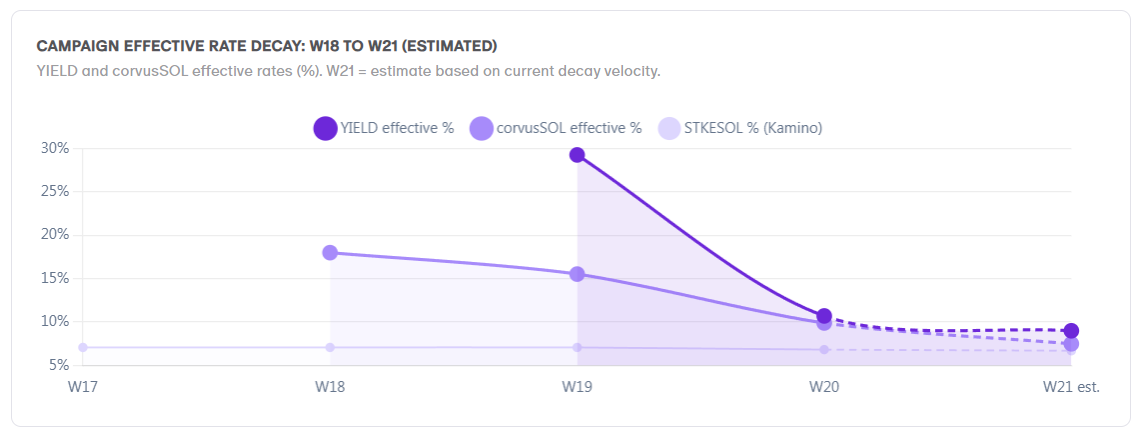
First, $YIELD emissions collapsed, they fell by 83% in one week.
Second, cgntSOL appeared with a 0.60% borrow rate.This gave users access to a much cheaper borrowing asset. Which opened a new group of leveraged LST strategies.
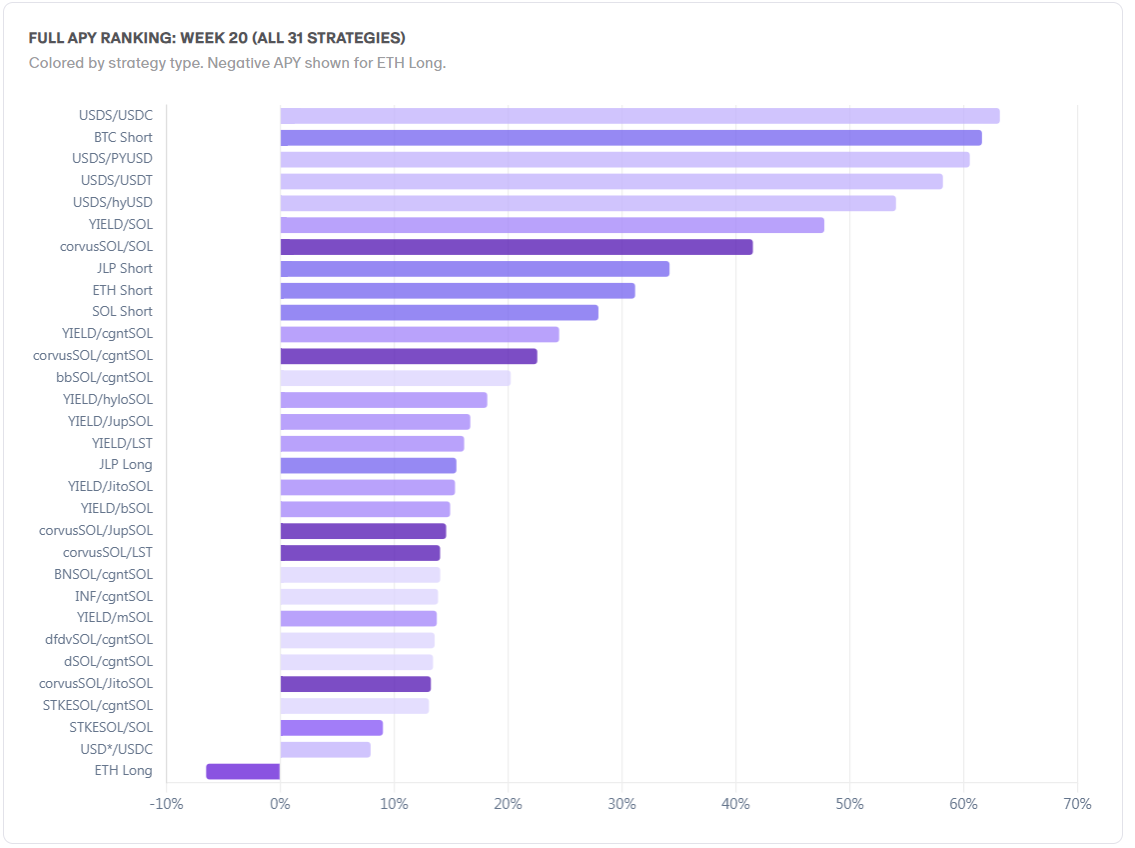
Snapshot
BTC Short and SOL Short are now the main large-capacity strategies still offering strong APY.
Rate Snapshot
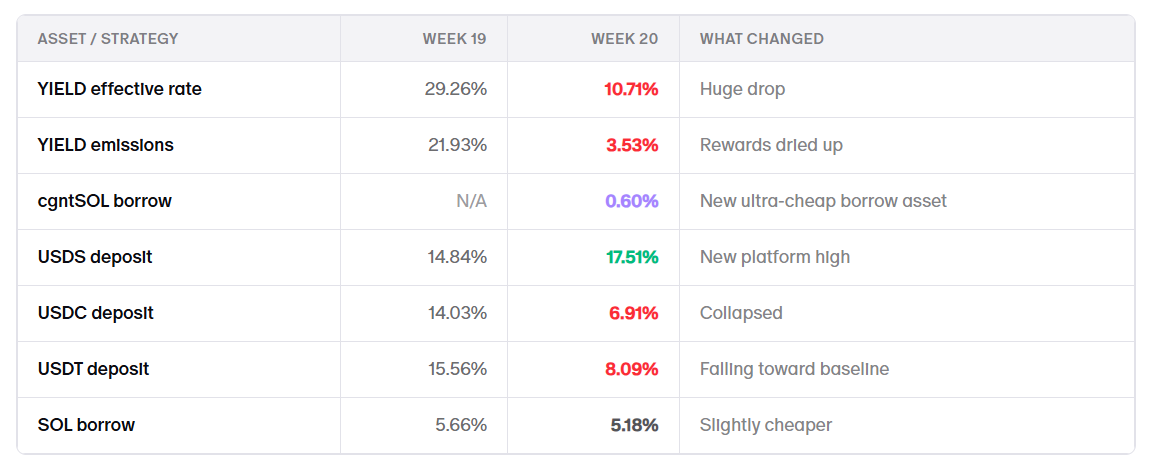
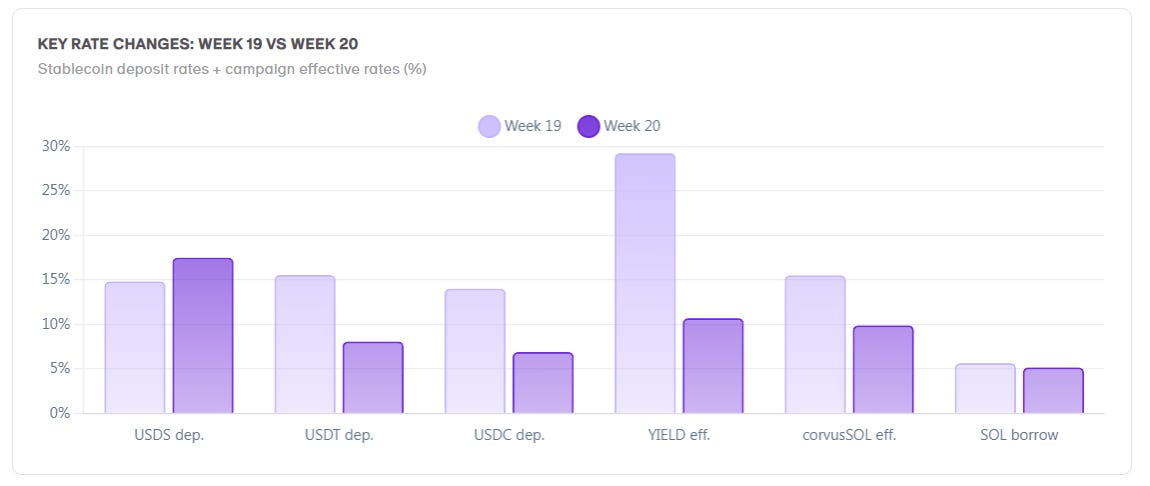
The whole week can be explained by two forces: $YIELD rewards disappeared faster than expected, and cgntSOL made borrowing much cheaper. Most of the market shifts this week were driven by those two developments.
$YIELD Collapse
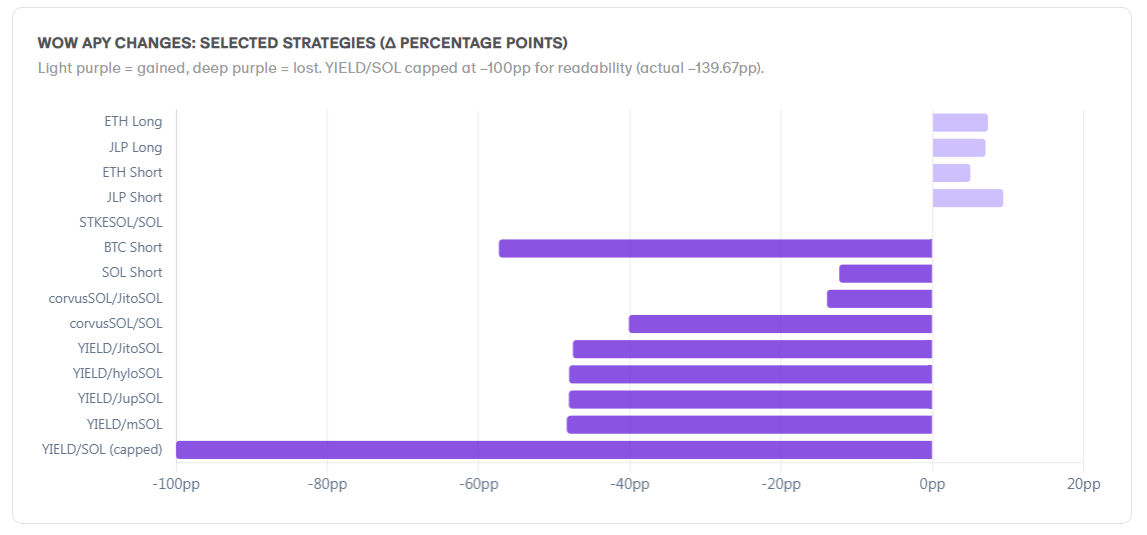
$YIELD emissions collapsed fast.
Week 19 emissions were 21.93%. One week later, they dropped to 3.53%, pulling effective rates down from 29.26% to 10.71%.
As rewards faded, leveraged $YIELD strategies got hit and TVL rotated elsewhere.
Platform Restructure
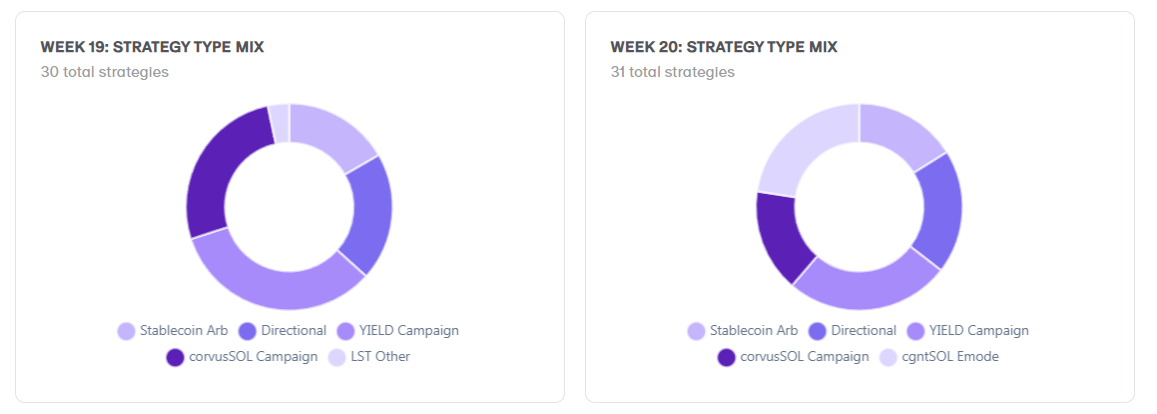
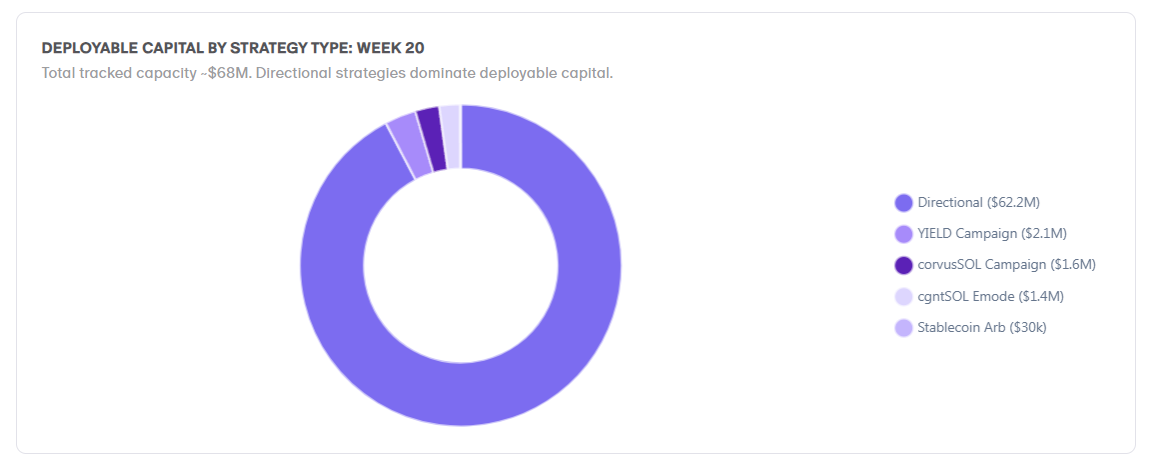
The strategy count barely changed (30 → 31), but the platform rotated heavily underneath.
12 strategies disappeared, 13 new ones launched. Campaign-driven and stablecoin arbitrage strategies were gradually replaced by USDS trades and the new cgntSOL LST tier.
USDS
USDS became the highest-paying stablecoin on the platform at 17.51% deposit APY.
That pushed some USDS-funded strategies above 50% APY, but most only support a few thousand dollars of capacity.
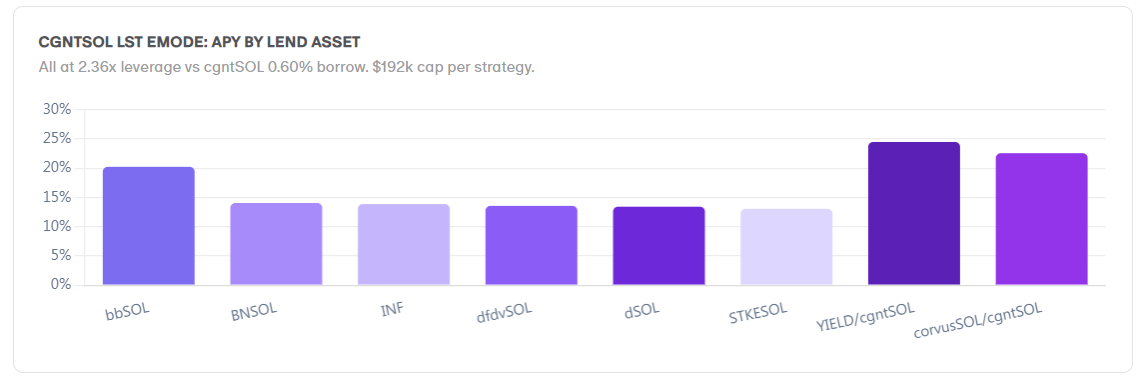
cgntSOL Tier
cgntSOL launched with a 0.60% borrow rate versus 5.18% for SOL.
Cheap leverage made LST carry trades much more attractive:
6% LST → ~13% leveraged APY
bbSOL at 8.91% → ~20% APY
The main risk is borrow utilization. If caps fill, rates rise and spreads compress.
Strategy Leaderboard
The highest APYs were mostly small-capacity USDS trades.
The most scalable opportunities remained in larger strategies like BTC Short and SOL Short.
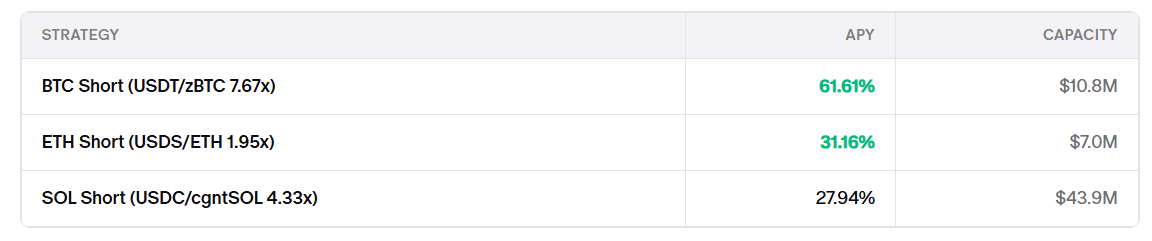
These three strategies represent most of the serious capacity on the platform.
Winners & Losers
Biggest losers:
$YIELD/SOL: 187.44% → 47.77%
corvusSOL/SOL: 81.64% → 41.50%
Biggest winners:
USDS-funded strategies
cgntSOL LST leverage trades
USDS trades offered higher APYs, while cgntSOL trades presented a cleaner long-term structure.
What’s Next
Things to watch
Will USDS follow the 1-week spike pattern and collapse?
Can $YIELD emissions stabilize or will they hit 0%?
cgntSOL borrow rate: will it rise as borrow caps fill?
Will P0 launch a new campaign to replace $YIELD?
USDT trajectory: approaching 6–7% structural baseline
Exit triggers
USDS-funded strategies: USDS deposit below 10%
$YIELD/SOL: $YIELD effective below 8%
BTC Short: USDT deposit below 6%
cgntSOL emode: cgntSOL borrow above 2%
SOL Short: cgntSOL borrow above 3%
Final Take
Week 20 felt like a transitional period for the market.
Campaign APYs cooled off, while capital started moving toward cleaner spreads and cheaper leverage.
The market is becoming less dependent on emissions and increasingly focused on capital efficiency.
Now that you know about cgntSOL borrow rates sitting near ~0%, you can put idle SOL to work by borrowing cgntSOL and leveraging staking yield today !
Try us here